

The Original Bed Co · UK ad account
14 months, in numbers
From 1 August 2025 to 30 September 2026, three sales campaigns reported 1,184 website purchases from £79,558.68 of ad spend, at £67.19 per reported purchase.
Reporting period: 14 calendar months · 426 days. Headline scope: Prospecting – TOF, RT – BOF and Testing – TOF from the supplied three-campaign CSV. Purchase value and ROAS are unavailable in these full-period files.
Reading the results
Where purchases came from
Prospecting accounts for 866 purchases, or 73.14% of the selected total. Its £62.82 cost per purchase sits below the combined £67.19.
Retargeting contributes 228 purchases at £87.35 each. Testing records 90 purchases at £58.23 each, the lowest reported acquisition cost among the three campaigns in this export.
The campaign names suggest prospecting, retargeting and testing roles. These aggregate results describe contribution and cost across the supplied period; they do not establish which audience or creative decisions caused performance.
Common scale: 0–900 purchases. Source: three-campaign export, 1 August 2025–30 September 2026.
Campaign detail · GBP
The full breakdown
| Campaign | Spend | Purchases | Cost / purchase | Purchase share |
|---|---|---|---|---|
| Prospecting – TOF | £54,401.82 | 866 | £62.82 | 73.14% |
| RT – BOF | £19,916.16 | 228 | £87.35 | 19.26% |
| Testing – TOF | £5,240.70 | 90 | £58.23 | 7.60% |
| Combined · 3 campaigns | £79,558.68 | 1,184 | £67.19 | 100.00% |
Combined cost per purchase uses total matching spend divided by total reported purchases. Campaign costs are not averaged. Purchase share is each campaign’s share of the selected three-campaign total.
Delivery and website visits
The traffic behind the result
| Campaign | Impressions | Link clicks | Landing-page views |
|---|---|---|---|
| Prospecting – TOF | 8,431,976 | 96,998 | 52,332 |
| RT – BOF | 2,244,319 | 18,455 | 9,741 |
| Testing – TOF | 634,107 | 6,566 | 2,318 |
| Combined · 3 campaigns | 11,310,402 | 122,019 | 64,391 |
Impressions, clicks and landing-page views are reported event totals. Campaign reach is not added because people may appear in more than one campaign’s audience. Link clicks, landing-page views and purchases are separate reporting metrics.
Keeping the sources clear
Reconciling the exports
Two exports, one defined headline scope
The three-campaign file reports £79,558.68 spend and 1,184 purchases. The same three names in the wider export report £79,688.64 spend and the same purchase count, giving £67.30 per purchase.
The £129.96 spend difference belongs to Prospecting. Its wider-export row also contains 39,442 more impressions, 242 more link clicks, 366 more all clicks and 72 more landing-page views. Retargeting and Testing agree across both files.
The supplied files do not establish why Prospecting differs. Each headline calculation stays within the three-campaign file, rather than mixing its purchases with another source’s spend.
The wider CSV contains 117 rows; the screenshots show “Results from 133 campaigns”. The CSV also contains awareness and traffic results and two additional purchase-reporting campaigns. Those account-wide rows sit outside this case study’s three-campaign headline scope.
| Metric | 117-row account CSV | Screenshot · 133 campaigns | CSV minus screenshot |
|---|---|---|---|
| Ad spend | £93,820.17 | £93,819.86 | +£0.31 |
| Impressions | 15,393,804 | 15,393,734 | +70 |
| Link clicks | 248,361 | 248,358 | +3 |
| All clicks | 311,511 | 311,508 | +3 |
| Landing-page views | 71,278 | 71,278 | 0 |
This table compares wider-account sources only. Screenshot footer reach is 3,502,700 Meta accounts; it is a reported account-wide figure, not a sum of campaign reach. The screenshot and CSV scope differs, and small total differences remain. No cause is assumed.
Original reporting · August 2025–September 2026
Evidence behind the numbers
The original screenshots show the full date range and wider-account reporting across three horizontal views. The purchase-count breakdown above comes from the CSV; these screenshots do not show all three sales-campaign purchase counts in full. Open any image to inspect it at full size.
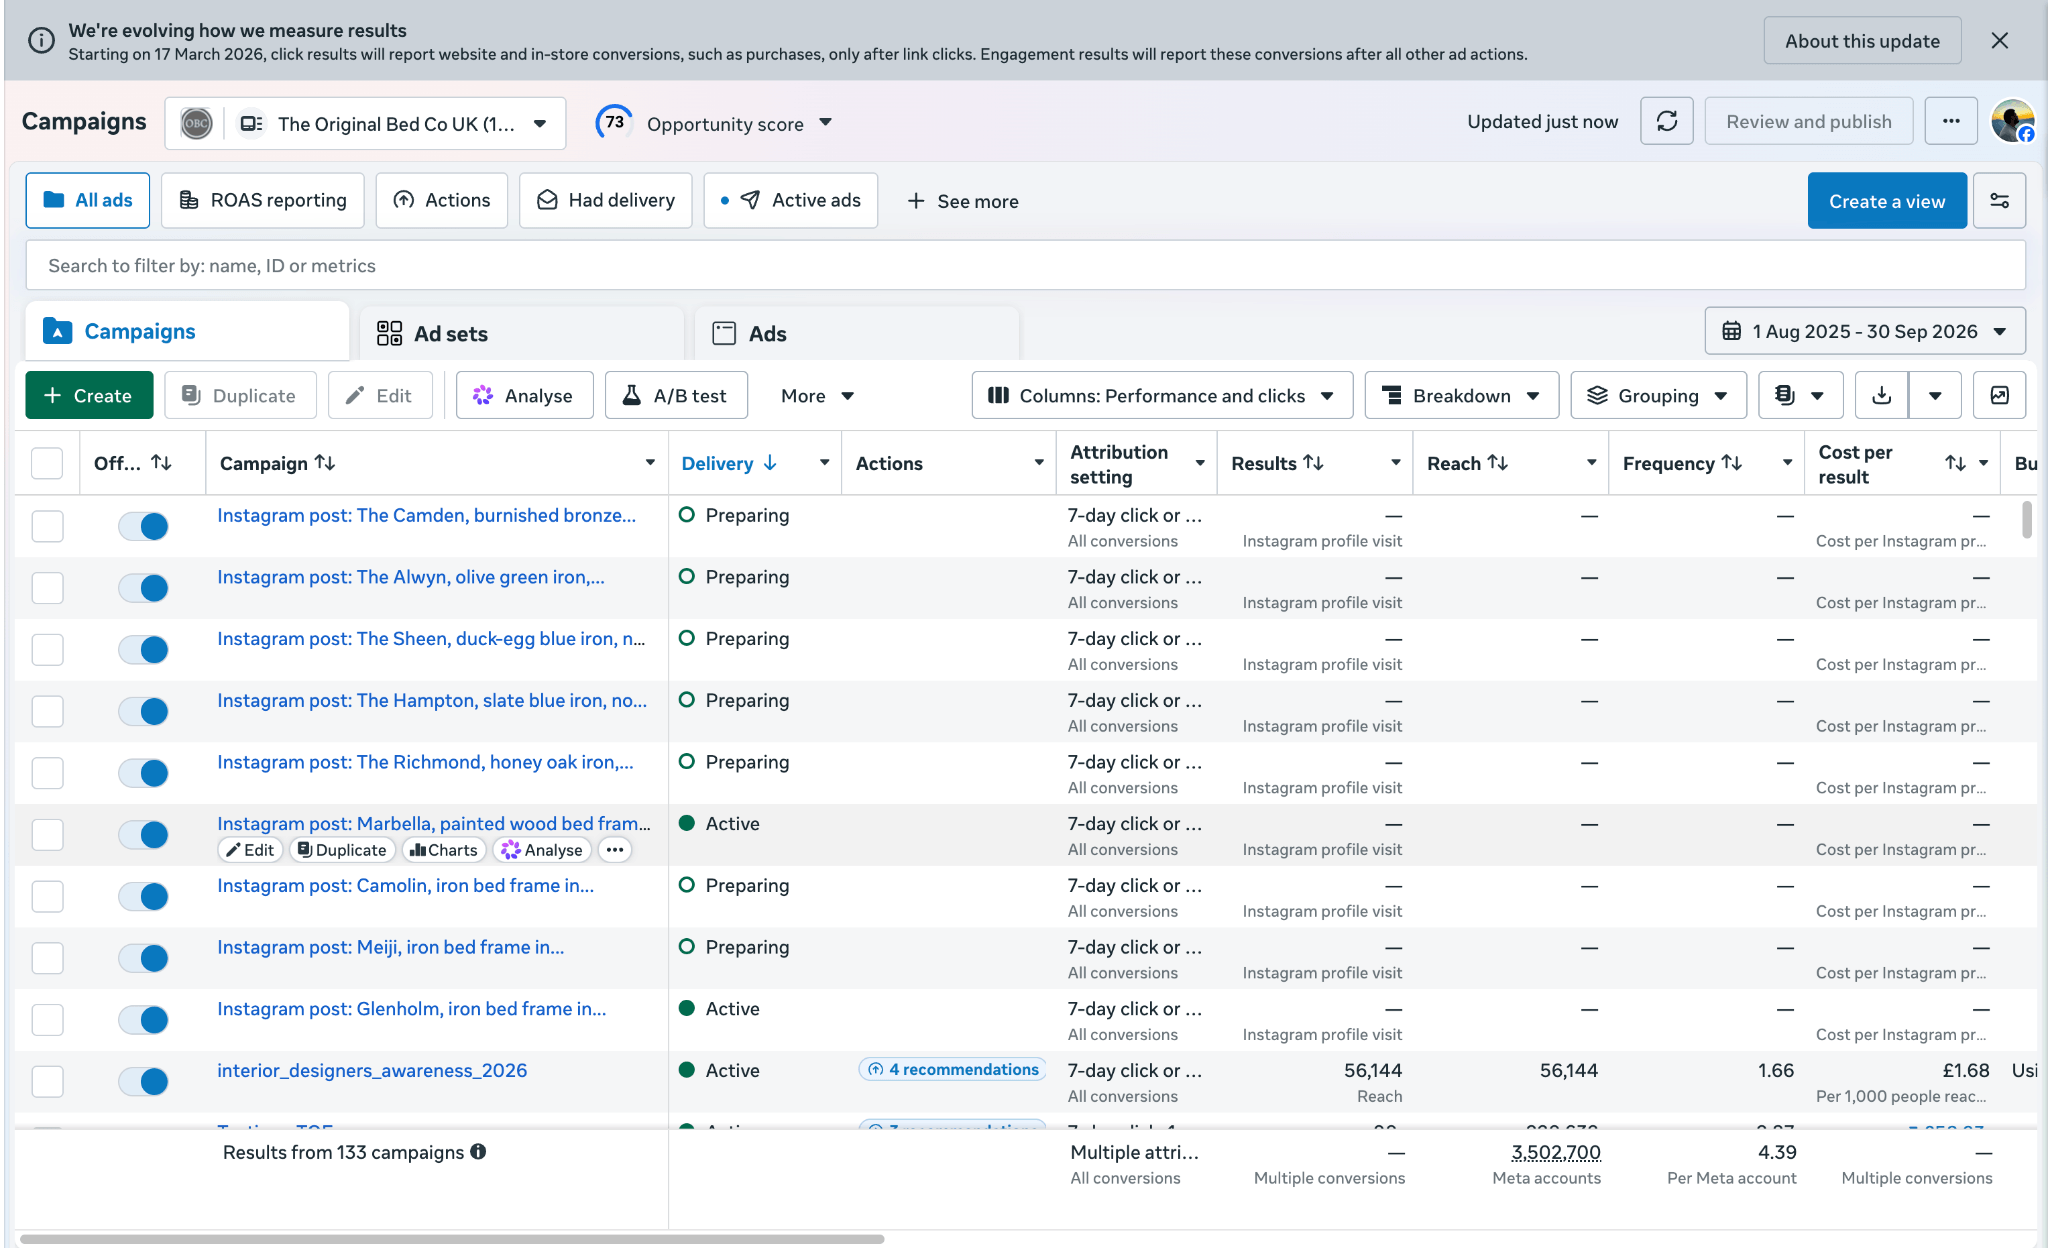
Period, reach and campaign scope
The date selector shows 1 August 2025–30 September 2026. The footer reports 133 campaigns and 3,502,700 Meta accounts reached; the visible rows include awareness and Instagram campaigns.
View full-size screenshot ↗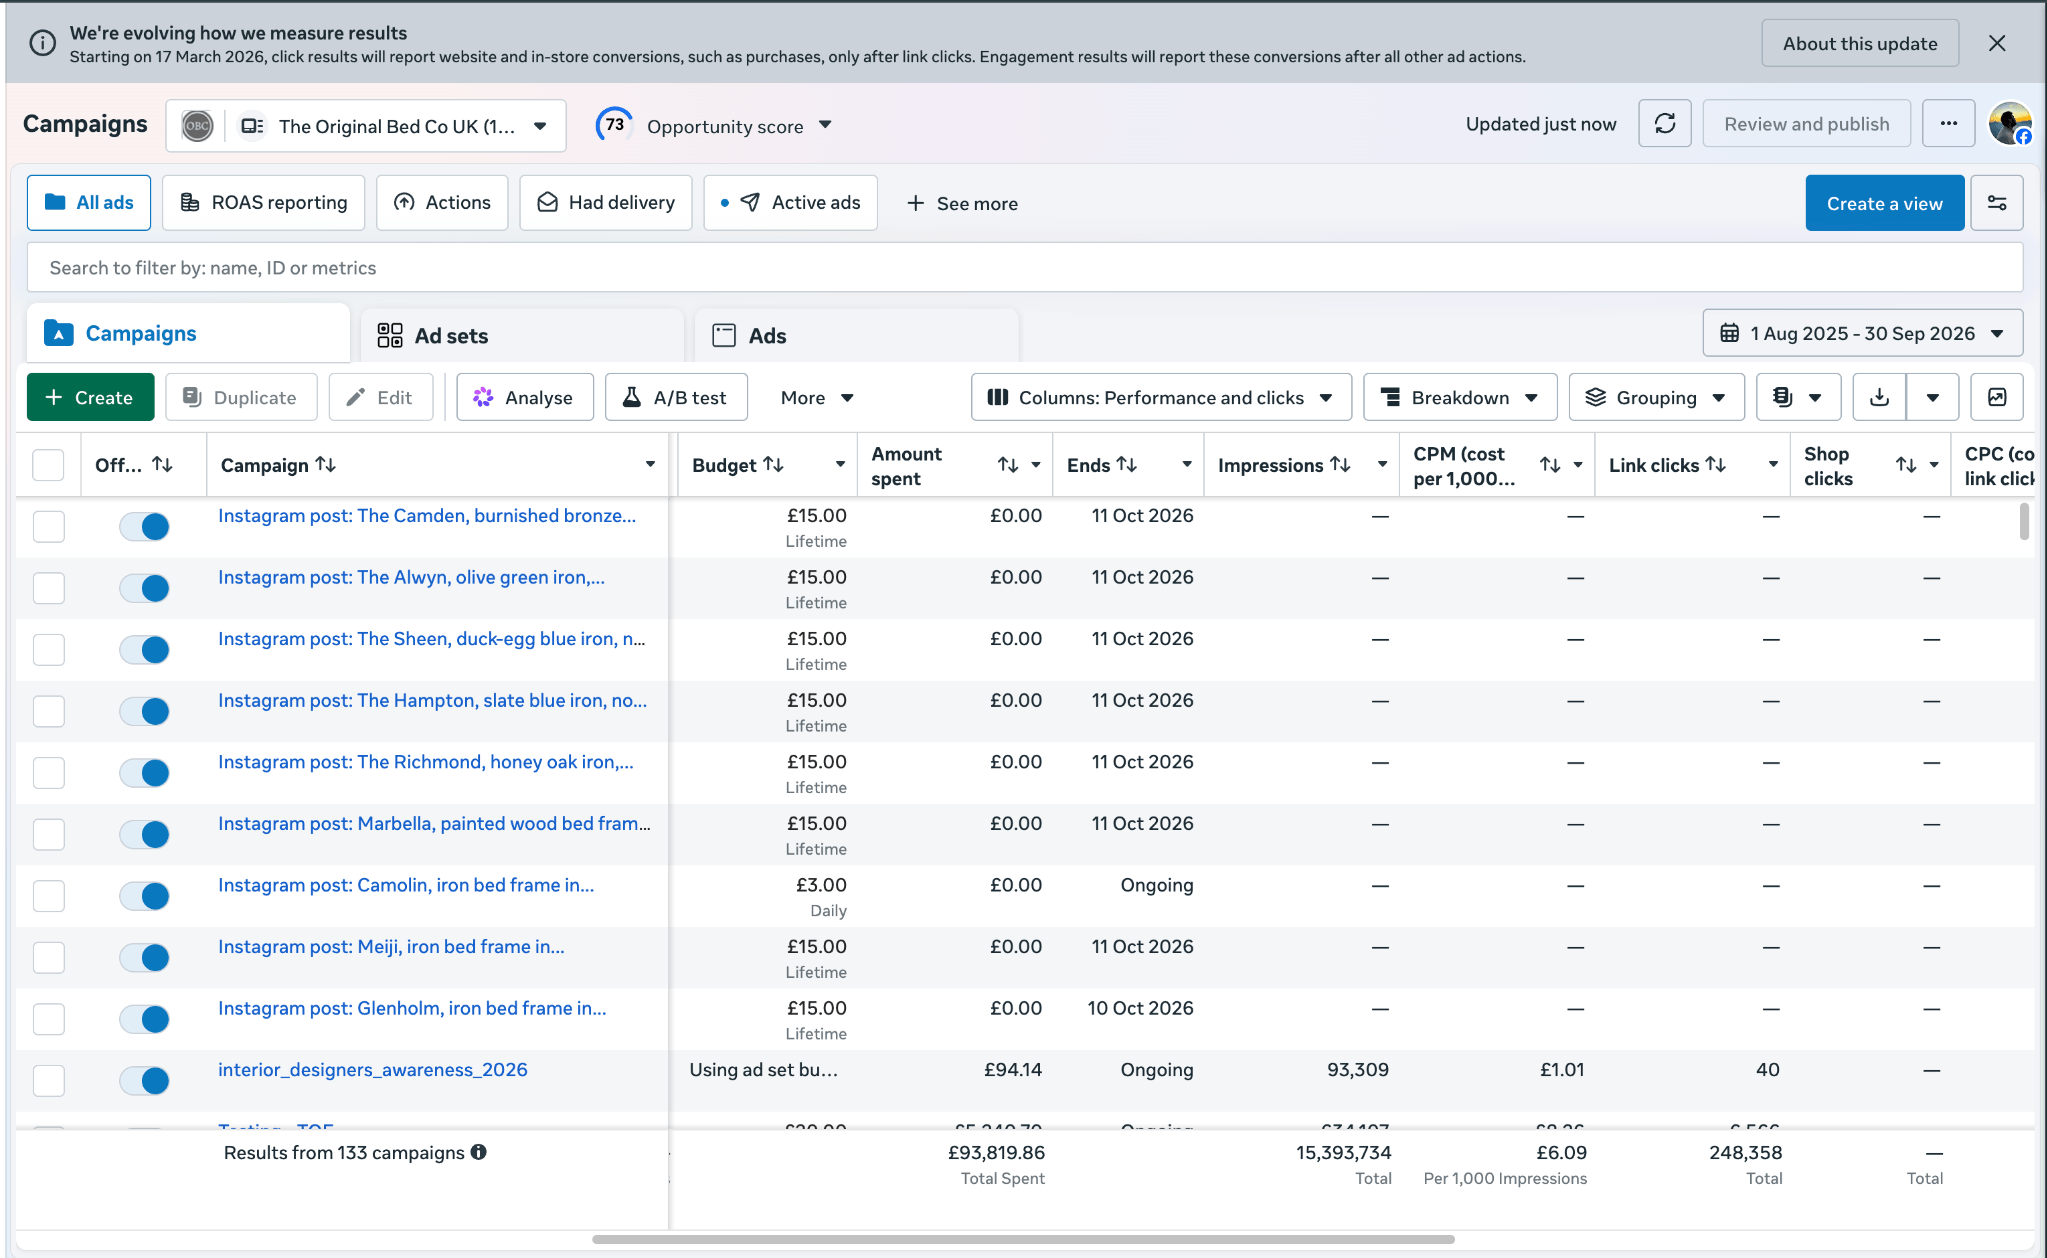
Wider-account spend and traffic
The footer reports £93,819.86 spend, 15,393,734 impressions and 248,358 link clicks. These account-wide figures are reconciled separately from the three sales campaigns.
View full-size screenshot ↗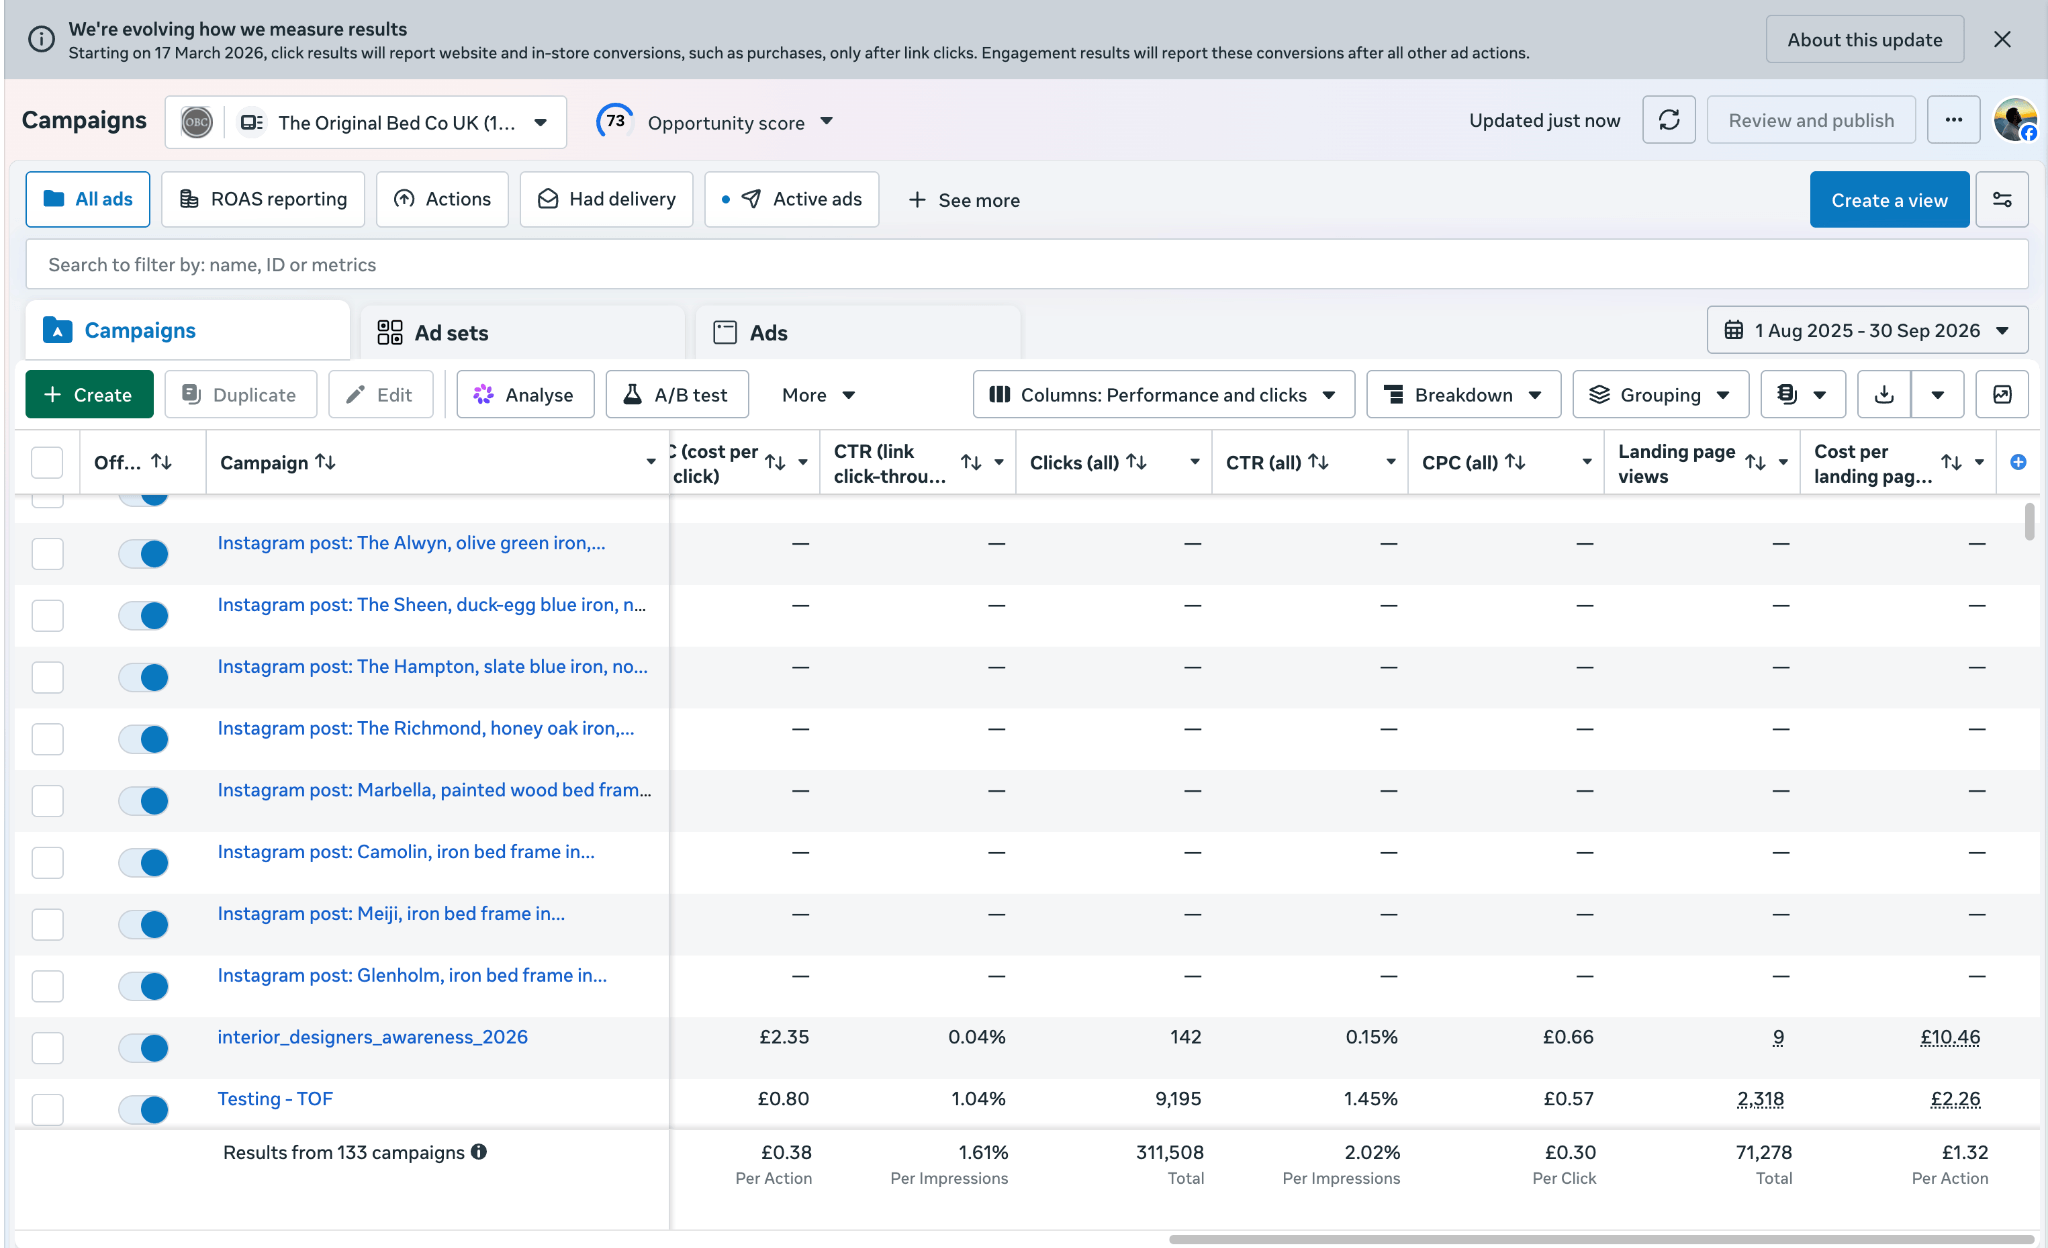
Clicks and landing-page views
The footer reports 311,508 all clicks and 71,278 landing-page views. Testing is visible with 9,195 all clicks and 2,318 landing-page views, matching both exports.
View full-size screenshot ↗Source, scope and attribution
Source: the supplied Meta Ads Manager exports for 1 August 2025–30 September 2026 and three original screenshots. All monetary figures are in GBP.
Headline source: The-Original-Bed-Co-UK-Campaigns-1-Aug-2025-30-Sep-2026.csv
Wider-account reconciliation: The-Original-Bed-Co-UK-Campaigns-1-Aug-2025-30-Sep-2026 (1).csv
Attribution: Prospecting is exported with “Multiple attribution settings”. Retargeting and Testing use “7-day click, 1-day view or 1-day engaged view”. The purchases are Meta-reported attributed website conversion results.
Calculation: £54,401.82 + £19,916.16 + £5,240.70 = £79,558.68. 866 + 228 + 90 = 1,184 purchases. £79,558.68 ÷ 1,184 = £67.19 per purchase, rounded to two decimals.
Period and reporting limits: these are aggregate totals across 14 months. Both full-period exports omit purchase value and ROAS. The screenshots carry a notice about a conversion-measurement update from 17 March 2026; no before/after measurement breakdown is supplied. The July–September monthly reports remain separate views within this period and are not added again to these totals.
The UK label identifies the ad account. The exports do not establish audience geography, individual responsibilities, creative changes, verified store revenue or incremental impact.
Continue exploring
From the wider period to monthly detail
July, August and September 2026 each have a dedicated report with their matching campaign breakdown, original screenshots and campaign context. September brings those three monthly exports into one comparison.