

The Original Bed Co · 1 August 2025–30 September 2026
Paid media.
Performance in view.
Fourteen months of Google Ads reporting, with monthly comparisons and the campaign mix in view. September 2026 records 204.82 reported conversions at £151.13 per conversion. That cost per conversion is 16.80% lower than September 2025.
Headline totals sum the 14 monthly CSV rows. Aggregate cost per conversion is total cost ÷ total reported conversions. GBP throughout. Conversion actions have not been verified as purchase-only.
Case study · Google Ads performance analysis
What sits behind the totals?
September closes the period with the highest monthly reported conversion total and the lowest reported cost per conversion.
The question
How do reported conversions and cost change month to month, and where does spend sit across the campaign mix?
The approach
Reconcile 17 CSV exports with the 11 original overview cards. Use monthly data for matched-period comparisons and keep campaign, device, network and search metrics within their own reporting scope.
The finding
September records 19.14% more reported conversions than September 2025 with 0.88% less cost. Brand Search and the broad Performance Max campaign account for a large share of campaign-reported conversions.
These are observed reporting results. The exports do not establish which management actions caused the changes, or the revenue and purchase mix behind the conversion totals.
Monthly results · Exact CSV values
September in context
204.82 reported conversions, £30,954.50 cost and £151.13 cost per conversion in September 2026.
| Comparison | Cost change | Click change | Conversion change | Cost / conversion change |
|---|---|---|---|---|
| September vs August 2026 | −2.86% | −6.85% | +24.99% | −22.28% |
| September 2026 vs September 2025 | −0.88% | −0.90% | +19.14% | −16.80% |
Changes use the matched months in the Time_series CSV. Cost-per-conversion changes use the reported monthly CPA values, which may differ slightly from ratios recalculated using rounded conversions.
Common scale: 0–250 reported conversions. Source: Time_series CSV. Values preserve the export precision.
| Month | Cost | Clicks | Conversions | Cost / conversion |
|---|---|---|---|---|
| Aug 2025 | £33,121.11 | 20,899 | 135.56 | £244.33 |
| Sep 2025 | £31,228.74 | 19,775 | 171.92 | £181.64 |
| Oct 2025 | £31,220.23 | 20,383 | 148.30 | £210.51 |
| Nov 2025 | £29,891.55 | 19,377 | 186.73 | £160.08 |
| Dec 2025 | £23,535.90 | 15,948 | 135.26 | £174.01 |
| Jan 2026 | £32,092.65 | 21,872 | 150.31 | £213.51 |
| Feb 2026 | £28,048.70 | 19,727 | 95.71 | £293.06 |
| Mar 2026 | £27,387.15 | 19,657 | 119.06 | £230.02 |
| Apr 2026 | £27,038.91 | 17,653 | 101.21 | £267.15 |
| May 2026 | £27,965.35 | 17,178 | 134.18 | £208.42 |
| Jun 2026 | £29,718.27 | 18,749 | 134.05 | £221.69 |
| Jul 2026 | £31,268.49 | 19,331 | 172.62 | £181.15 |
| Aug 2026 | £31,864.75 | 21,039 | 163.87 | £194.45 |
| Sep 2026 | £30,954.50 | 19,598 | 204.82 | £151.13 |
The monthly rows sum to £415,336.30 cost, 271,186 clicks and 2,053.60 reported conversions. £202.25 is the aggregate cost per conversion, rather than the average of monthly CPA values.
Campaign breakdown · 18 exported rows
The campaign mix
UK Brand Search
£17,272.38 cost, 777.43 reported conversions and £22.22 reported cost per conversion. This row contributes 37.86% of conversions in the campaign export.
All Performance Max
£84,220.22 cost, 641.86 reported conversions and £131.21 cost per conversion for “UK | ENG | ALL | PMX | OBC | ALL”.
Generic Search
The largest cost row, “UK | ENG | GENER | SEA | OBC | ALL”, records £184,324.15 cost, 181.77 conversions and £1,014.06 cost per conversion.
| Campaign | Status | Cost | Conversions | Cost / conversion |
|---|---|---|---|---|
| UK | ENG | GENER | SEA | OBC | ALL | Enabled | £184,324.15 | 181.77 | £1,014.06 |
| UK | ENG | ALL | PMX | OBC | ALL | Enabled | £84,220.22 | 641.86 | £131.21 |
| UK | ENG | GENERIC | SEA | OBC | CONVERSION | Enabled | £36,508.20 | 145.07 | £251.66 |
| UK | ENG | POCKET SPRING MATTRESSES | PMX | OBC | ALL | Enabled | £23,919.06 | 148.18 | £161.42 |
| UK | ENG | BRASS | SEA | OBC | ALL | Enabled | £21,135.72 | 33.18 | £637.07 |
| UK | ENG | BRAND | SEA | OBC | ALL | Enabled | £17,272.38 | 777.43 | £22.22 |
| UK | ENG | UPHOLSTERED | PMX | OBC | ALL | Enabled | £13,544.25 | 50.60 | £267.65 |
| UK | ENG | POCKET SPRING MATTRESSES | SEA | OBC | ALL | Enabled | £10,660.91 | 35.38 | £301.31 |
| UK | ENG | UPHOLSTERED | SEA | OBC | ALL | Enabled | £7,539.64 | 2.07 | £3,633.66 |
| IE | ENG | METAL BEDS | SEA | OBC | ALL | Enabled | £6,233.37 | 12.27 | £508.14 |
| UK | ENG | UPHOLSTERED | SHP | OBC | ALL | Paused | £5,645.79 | 7.30 | £773.43 |
| UK | ENG | METAL BED SIZES | SEA | OBC | ALL | Paused | £2,157.16 | 2.19 | £983.39 |
| UK | ENG | ALL | SEA | OBC | RLSA | Enabled | £961.00 | 4.23 | £227.37 |
| UK | ENG | ALL | DSA | OBC | ALL | Paused | £550.30 | 2.00 | £275.15 |
| UK | ENG | ALL | DYNAMIC REMARKETING | OBC | PRODUCT VIEWERS | Paused | £537.88 | 0.00 | — |
| IE | ENG | BRAND | SEARCH | OBC | ALL | Enabled | £126.26 | 10.09 | £12.52 |
| S | Metal Beds | ENG | IE S | Metal Beds | ENG | IE | New-Build | Enabled | £0.00 | 0.00 | — |
| S | Generic | ENG | UK S | Generic | ENG | UK | New-Build | Enabled | £0.00 | 0.00 | — |
All 18 rows in the supplied Campaigns CSV are shown, including enabled, paused and two zero-cost new-build rows. Labels include UK and IE campaigns. Status reflects the export, rather than proving the status throughout the period. Reported CPA is retained; “—” indicates no reported conversions, where CPA is undefined.
Campaign rows total £415,336.29 cost and 2,053.62 reported conversions. That differs from the monthly export by £0.01 in cost and 0.02 conversions. The exports are retained separately; no balancing adjustment is added.
Device breakdown · CSV values
A different mix by device
Mobile phones record 200,877 clicks and 1,044.70 reported conversions. Computers record 55,666 clicks and 916.15 conversions.
Within the device export, mobile contributes 74.08% of clicks and 50.87% of conversions. Computers contribute 20.53% and 44.61%, respectively. This gives a useful starting point for reviewing the mobile landing-page and checkout experience.
| Device | Cost | Clicks | Conversions | Cost / conversion |
|---|---|---|---|---|
| Computers | £115,592.88 | 55,666 | 916.15 | £126.17 |
| Mobile phones | £280,480.07 | 200,877 | 1,044.70 | £268.48 |
| Tablets | £19,149.84 | 14,622 | 92.75 | £206.47 |
| TV screens | £113.17 | 6 | 0.00 | — |
Device CPA is calculated as device cost ÷ reported conversions. The device export totals £415,335.96 cost, 271,171 clicks and 2,053.60 conversions: £0.34 and 15 clicks below the monthly export. The source does not explain the difference. These metrics do not establish revenue per device or purchase-only efficiency.
Network breakdown · Delivery and cost
Where the ads appeared
Google search records £293,114.88 cost and 177,268 clicks. Cross-network records £121,683.53 and 92,439 clicks.
Reported average CPC is £1.65 on Google search and £1.32 on Cross-network. The network export includes click delivery and cost, with no conversion-value column.
Common scale: 0–100% of cost in the Networks CSV.
| Network | Clicks | Cost | Average CPC |
|---|---|---|---|
| Google search | 177,268 | £293,114.88 | £1.65 |
| Display network | 1,479 | £537.88 | £0.36 |
| Cross-network | 92,439 | £121,683.53 | £1.32 |
Network rows total £415,336.29 cost and 271,186 clicks. Cost is £0.01 below the monthly total. Average CPC values retain the export rounding.
Search keywords, queries and an ad example
Brand and product demand
The exact-match keyword [original bed company] records 17,744 clicks and 50.33% CTR. The phrase-match keyword “metal bed” records 21,943 clicks, £40,110.24 cost and 7.01% CTR.
Explore all 50 exported keyword rows
| Keyword | Match type | Cost | Clicks | CTR |
|---|---|---|---|---|
| "metal bed" | Phrase match | £40,110.24 | 21,943 | 7.01% |
| [Heavy duty metal bed frames] | Exact match | £9,861.05 | 5,663 | 22.75% |
| [original bed company] | Exact match | £8,831.08 | 17,744 | 50.33% |
| [metal bed frame] | Exact match | £8,415.24 | 4,632 | 6.02% |
| [brass bed frame] | Exact match | £6,549.15 | 2,663 | 5.46% |
| "iron bed" | Phrase match | £5,628.06 | 3,116 | 9.22% |
| "metal bed king" | Phrase match | £5,339.35 | 3,295 | 9.16% |
| "wrought iron beds online" | Phrase match | £5,013.19 | 2,997 | 14.29% |
| "metal bed frame double" | Phrase match | £4,795.54 | 2,974 | 7.05% |
| [Single brass bed] | Exact match | £4,753.47 | 1,700 | 5.27% |
| [the original bed company] | Exact match | £4,625.66 | 9,044 | 47.95% |
| "metal bed single" | Phrase match | £4,374.38 | 2,698 | 6.53% |
| "brass bed frame" | Phrase match | £4,305.02 | 1,497 | 6.59% |
| [iron bed company] | Exact match | £4,186.10 | 940 | 35.70% |
| [metal beds] | Exact match | £2,969.27 | 1,659 | 12.74% |
| [metal bed frames] | Exact match | £2,832.53 | 1,568 | 10.70% |
| [small double metal bed] | Exact match | £2,750.70 | 1,674 | 9.90% |
| "small double metal bed" | Phrase match | £2,729.42 | 1,667 | 8.40% |
| [king size metal bed frame] | Exact match | £2,665.16 | 1,553 | 9.02% |
| [iron bed company] | Exact match | £2,211.52 | 1,280 | 31.02% |
| [strong metal bed frame king] | Exact match | £2,208.56 | 1,238 | 13.29% |
| [iron bed frame] | Exact match | £2,166.01 | 1,229 | 11.58% |
| "4ft metal bed" | Phrase match | £1,976.44 | 1,225 | 15.18% |
| "metal bed" | Phrase match | £1,951.31 | 915 | 5.09% |
| [metal bed frame double] | Exact match | £1,946.24 | 1,019 | 8.03% |
| [super king metal bed frame] | Exact match | £1,933.54 | 1,191 | 11.64% |
| [Heavy duty double bed frame] | Exact match | £1,868.17 | 1,046 | 12.24% |
| [metal frame bed] | Exact match | £1,847.60 | 1,029 | 7.40% |
| [cast iron bed frame] | Exact match | £1,755.03 | 1,000 | 19.38% |
| [Heavy duty metal bed frame UK] | Exact match | £1,664.83 | 1,002 | 24.36% |
| [metal bed frame king] | Exact match | £1,654.03 | 1,025 | 10.91% |
| [iron bed] | Exact match | £1,652.66 | 481 | 13.30% |
| "metal bed frame with storage" | Phrase match | £1,645.07 | 882 | 8.80% |
| [iron framed bed] | Exact match | £1,617.46 | 892 | 17.16% |
| "wrought iron beds" | Phrase match | £1,612.10 | 862 | 11.46% |
| [brass bed] | Exact match | £1,570.08 | 478 | 5.41% |
| [metal bed frame double] | Exact match | £1,495.37 | 938 | 8.74% |
| [wrought iron beds] | Exact match | £1,447.02 | 843 | 18.72% |
| "buy metal beds" | Phrase match | £1,446.47 | 792 | 8.71% |
| "upholstered beds" | Phrase match | £1,442.88 | 561 | 3.17% |
| [cast iron beds] | Exact match | £1,440.35 | 454 | 14.47% |
| [cast iron beds] | Exact match | £1,403.88 | 808 | 21.95% |
| [strong metal bed frame double] | Exact match | £1,402.91 | 766 | 14.33% |
| [metal double bed frame] | Exact match | £1,324.65 | 819 | 6.93% |
| [king size metal bed] | Exact match | £1,308.02 | 742 | 9.42% |
| [wrought iron bed frame] | Exact match | £1,307.42 | 389 | 14.77% |
| [single bed frame metal] | Exact match | £1,301.60 | 747 | 7.02% |
| "super king metal bed" | Phrase match | £1,283.93 | 792 | 10.58% |
| [wrought iron bed frame] | Exact match | £1,278.12 | 718 | 17.68% |
| [metal frame beds] | Exact match | £1,252.34 | 665 | 11.03% |
Keyword metrics retain their own scope. They are not assigned to the separate search-phrase rows.
Search phrases in the CSV
The search phrase “original bed company” records 134,986 impressions, 17,271 clicks and £8,960.80 cost. The table shows the first ten of 100 supplied search rows, ordered by impressions.
| Search phrase | Cost | Clicks | Impressions |
|---|---|---|---|
| original bed company | £8,960.80 | 17,271 | 134,986 |
| metal bed frame | £9,260.49 | 4,750 | 80,966 |
| the original bed company | £4,877.72 | 9,094 | 63,771 |
| metal bed frame double | £3,623.07 | 2,015 | 24,387 |
| metal double bed frame | £1,972.65 | 1,083 | 18,459 |
| metal frame bed | £1,696.28 | 887 | 14,411 |
| metal beds | £3,619.61 | 1,811 | 14,380 |
| metal bed | £1,481.33 | 744 | 13,717 |
| black metal bed frame | £957.37 | 505 | 13,704 |
| metal bed frames | £2,769.63 | 1,451 | 13,300 |
All 100 search rows record 0.00 in the supplied Conversions column. The relationship of that field to the account conversion setup is unverified, so this view focuses on cost and delivery. Word-level rows can overlap across queries and are not summed into account totals.
An ad in the source
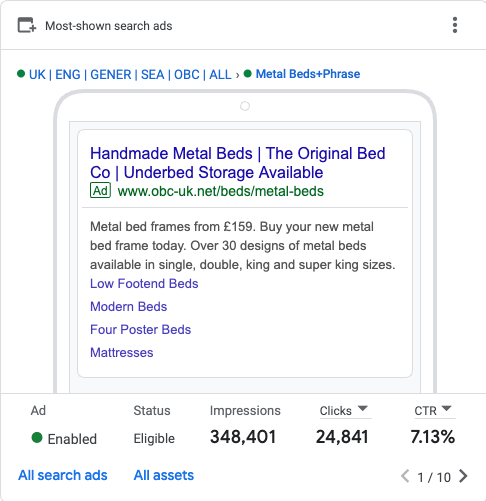
The original Most-shown search ads card displays a metal-bed ad with underbed-storage messaging and four visible sitelinks. It records 348,401 impressions, 24,841 clicks and 7.13% CTR.
This is one ad on page 1 of 10, in its own reporting scope. Its copy, price and Enabled/Eligible status are historical source evidence. No conversion-value result is supplied for the ad.
17 CSV exports + 11 original cards
Inspect the source views
The report combines the 17 CSV exports supplied on 13 October 2026 with these 11 original overview cards. Monthly and tabular detail comes from the CSVs. The images preserve the earlier displayed views and their rounding.

Account overview
Rounded cost, clicks, conversions and cost per conversion, plus the supplied time-series plot.
Open original card ↗
Campaigns
Five visible rows; first page of four. Cost, conversions and cost per conversion.
Open original card ↗
Devices
Rounded shares of cost, clicks and conversions across the four device labels.
Open original card ↗
Networks
Rounded click and cost shares, plus displayed average CPC.
Open original card ↗
Search keywords
Five visible keyword rows with cost, clicks and CTR.
Open original card ↗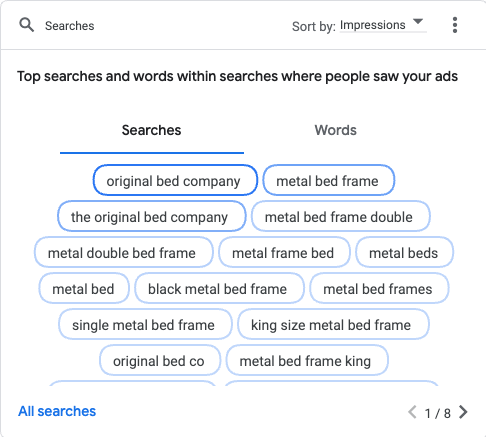
Searches
Search phrases sorted by impressions. This earlier card omits exact counts; the new CSV supplies 100 search rows.
Open original card ↗Ad example
One visible ad, with 348,401 impressions, 24,841 clicks and 7.13% CTR.
Open original card ↗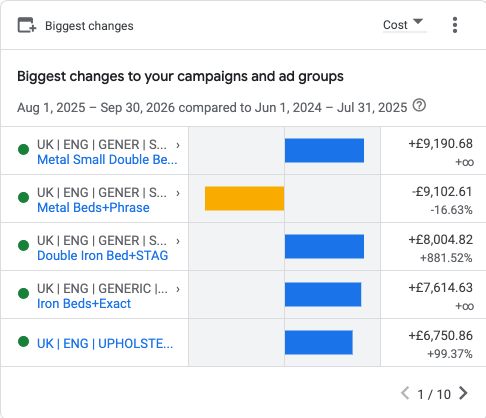
Cost changes
Selected cost changes: 1 Aug 2025–30 Sep 2026 compared with 1 Jun 2024–31 Jul 2025. This is not a month-over-month comparison.
Open original card ↗
Auction insights
Source plot of impression share and top-of-page rate. The new comparison CSV records 22.38% impression share and 87.94% top-of-page rate for “You”. No auction time series is supplied.
Open original card ↗
Demographics
Impression heatmap based on the 53% of impressions with known gender and age. No demographic conversion results are shown.
Open original card ↗
Day and hour
Impression heatmap by day and hour. The new CSVs supply impression counts by day and hour, with no conversion performance.
Open original card ↗Reporting scope · Sources and limits
Keep the scope in view
Conversion definitions
The exports use Google Ads “Conversions” without identifying the included primary actions or attribution settings. Conversions are not relabelled as purchases, unique orders or new customers.
Revenue and return
No conversion-value field is included in the 17 CSVs, so Google Ads revenue, ROAS and profit remain unreported. The separate GA4 study uses its own reporting and attribution scope.
Next reporting detail
A conversion-action breakdown and conversion value by month and campaign would support purchase-specific efficiency and reported return analysis.
Source files, reconciliation and interpretation
Sources: Overview_cards_csv(2026-10-13_11_11_28).zip contains 17 CSV exports. Overview_cards_png(2026-10-12_10_35_27).zip contains the 11 original cards. The current reporting period is 1 August 2025–30 September 2026. The export timestamps are distinct from that reporting period.
Monthly headline basis: Time_series supplies 14 monthly rows. Cost, clicks and conversions are summed at the displayed source precision. Aggregate CPA is their cost/conversion ratio. Monthly and campaign CPA values retain the reported source values.
Reconciliation: the monthly export totals £415,336.30 cost, 271,186 clicks and 2,053.60 conversions. Campaigns totals £415,336.29 and 2,053.62 conversions. Networks totals £415,336.29 and 271,186 clicks. Devices totals £415,335.96, 271,171 clicks and 2,053.60 conversions. These differences are disclosed without assigning an unsupported cause.
Coverage: all 18 campaign rows and all 50 keyword rows supplied are represented. The search table shows the first 10 of 100 rows. Two zero-cost new-build campaigns are retained. An overview-card CSV export does not establish complete account coverage for every dimension.
Other exports: Biggest_changes compares 1 August 2025–30 September 2026 with 1 June 2024–31 July 2025. That differs from the matched monthly comparisons above. Auction comparison columns repeat the same values and do not establish a separate historical change. The auction metric-over-time file contains only “You”, with no dated metrics. Optimization scores are retained in the source and are not treated as historical performance results.
Audience and timing: age, gender and day/hour exports report impressions. The gender percentage column sums to 100.70%, so no normalized demographic shares are manufactured. The original demographics card states 53% known age/gender coverage. Impression heatmaps do not identify conversion efficiency or account-wide audience coverage. Hour labels are retained without inferring the account timezone.