

The Original Bed Co · 1 August 2025–30 September 2026
Search traffic.
Revenue in view.
Organic Search recorded 127,282 sessions, 761 purchase events and £625,407.80 in GA4-reported revenue across 14 months. The September comparison shows higher reported revenue alongside fewer sessions.
14 calendar months · All Users in OBC – GA4 · Session primary channel group. Exact revenue: £625,407.80. This is property-wide reporting, including international traffic.
Case study · Organic-search performance analysis
What changed behind the traffic?
The question is how organic search contributes to the business, and whether traffic and reported revenue move together.
The question
What does the Organic Search channel contribute across the supplied period, and how does September 2026 compare with August 2026 and September 2025?
The approach
Read the Organic Search row in each GA4 acquisition export, calculate changes from the exact values, and inspect the Google query and page previews separately.
The finding
September organic revenue rose 28.26% month over month and 58.33% year over year. Sessions fell in both comparisons, so visits alone do not tell the full performance story.
These are reported outcomes. The exports do not establish which SEO actions caused them, or document an SEO campaign implementation.
Monthly and same-month comparisons
More revenue, fewer sessions
September 2026 recorded £64,718.05 in Organic Search revenue from 7,977 sessions.
That is £14,260.12 more reported revenue than August 2026 and £23,842.40 more than September 2025. Recorded revenue per session also increased across these selected months.
August has 31 days; each September has 30. Comparisons below use the complete reported calendar months.
Common scale: £0–£70,000. Selected full months, not a continuous monthly trend.
| Period | Days | Sessions | GA4 revenue | Revenue / session |
|---|---|---|---|---|
| September 2025 | 30 | 10,458 | £40,875.65 | £3.91 |
| August 2026 | 31 | 9,229 | £50,457.93 | £5.47 |
| September 2026 | 30 | 7,977 | £64,718.05 | £8.11 |
Revenue per session is calculated as GA4-reported channel revenue ÷ sessions, using unrounded inputs. It is not average order value, a purchase conversion rate or profit. The monthly exports do not support a September 2026 purchase-count comparison.
Google organic search · Acquisition overview preview
Brand and product searches
The supplied overview displays both brand phrases and product searches among its leading query previews.
| Displayed query | Google organic clicks |
|---|---|
| original bed company | 6.4K |
| the original bed company | 4.4K |
| metal bed frame | 3.3K |
| four poster bed | 1.2K |
| metal beds | 1.1K |
| original bed co | 1.1K |
| iron bed frame | 1.1K |
“original bed company” appears with 6.4K clicks and “metal bed frame” with 3.3K. These are the rounded values displayed in the Acquisition overview, for 1 August 2025–30 September 2026.
Selected preview rows only. They are not a full Search Console export, keyword-ranking trend or total click count. Google search clicks have a different scope from GA4 Organic Search sessions; no purchase or revenue is assigned to an individual query here.
Google organic search · Page-impression preview
Products across markets
The page preview includes international iron-bed collections and the India bed-size page. These are visibility observations from the supplied overview.
| Displayed page path | Google organic impressions |
|---|---|
| /us/products/beds/iron | 2.5M |
| /products/beds/iron | 1.5M |
| /in/products/beds/sizes | 1.4M |
| /in/products/beds/iron | 593K |
Rounded values as displayed, across the same 14-month overview period. Only complete paths are reproduced; other paths in the source are truncated. Impressions are search appearances, not visits, rankings or evidence of sales caused by a page.
Original reporting · Open the evidence
The figures at their source
The report images below preserve the supplied source views. Open an image or PDF to inspect the period, channel row and metric selection.

14-month channel results
1 Aug 2025–30 Sep 2026. Page 1 shows the Organic Search row with Event count set to purchase. The link opens the complete two-page export.
Open source PDF ↗
September 2025
1–30 Sep 2025. Table reproduced from page 2. Organic Search: 10,458 sessions and £40,875.65 revenue; complete export linked.
Open source PDF ↗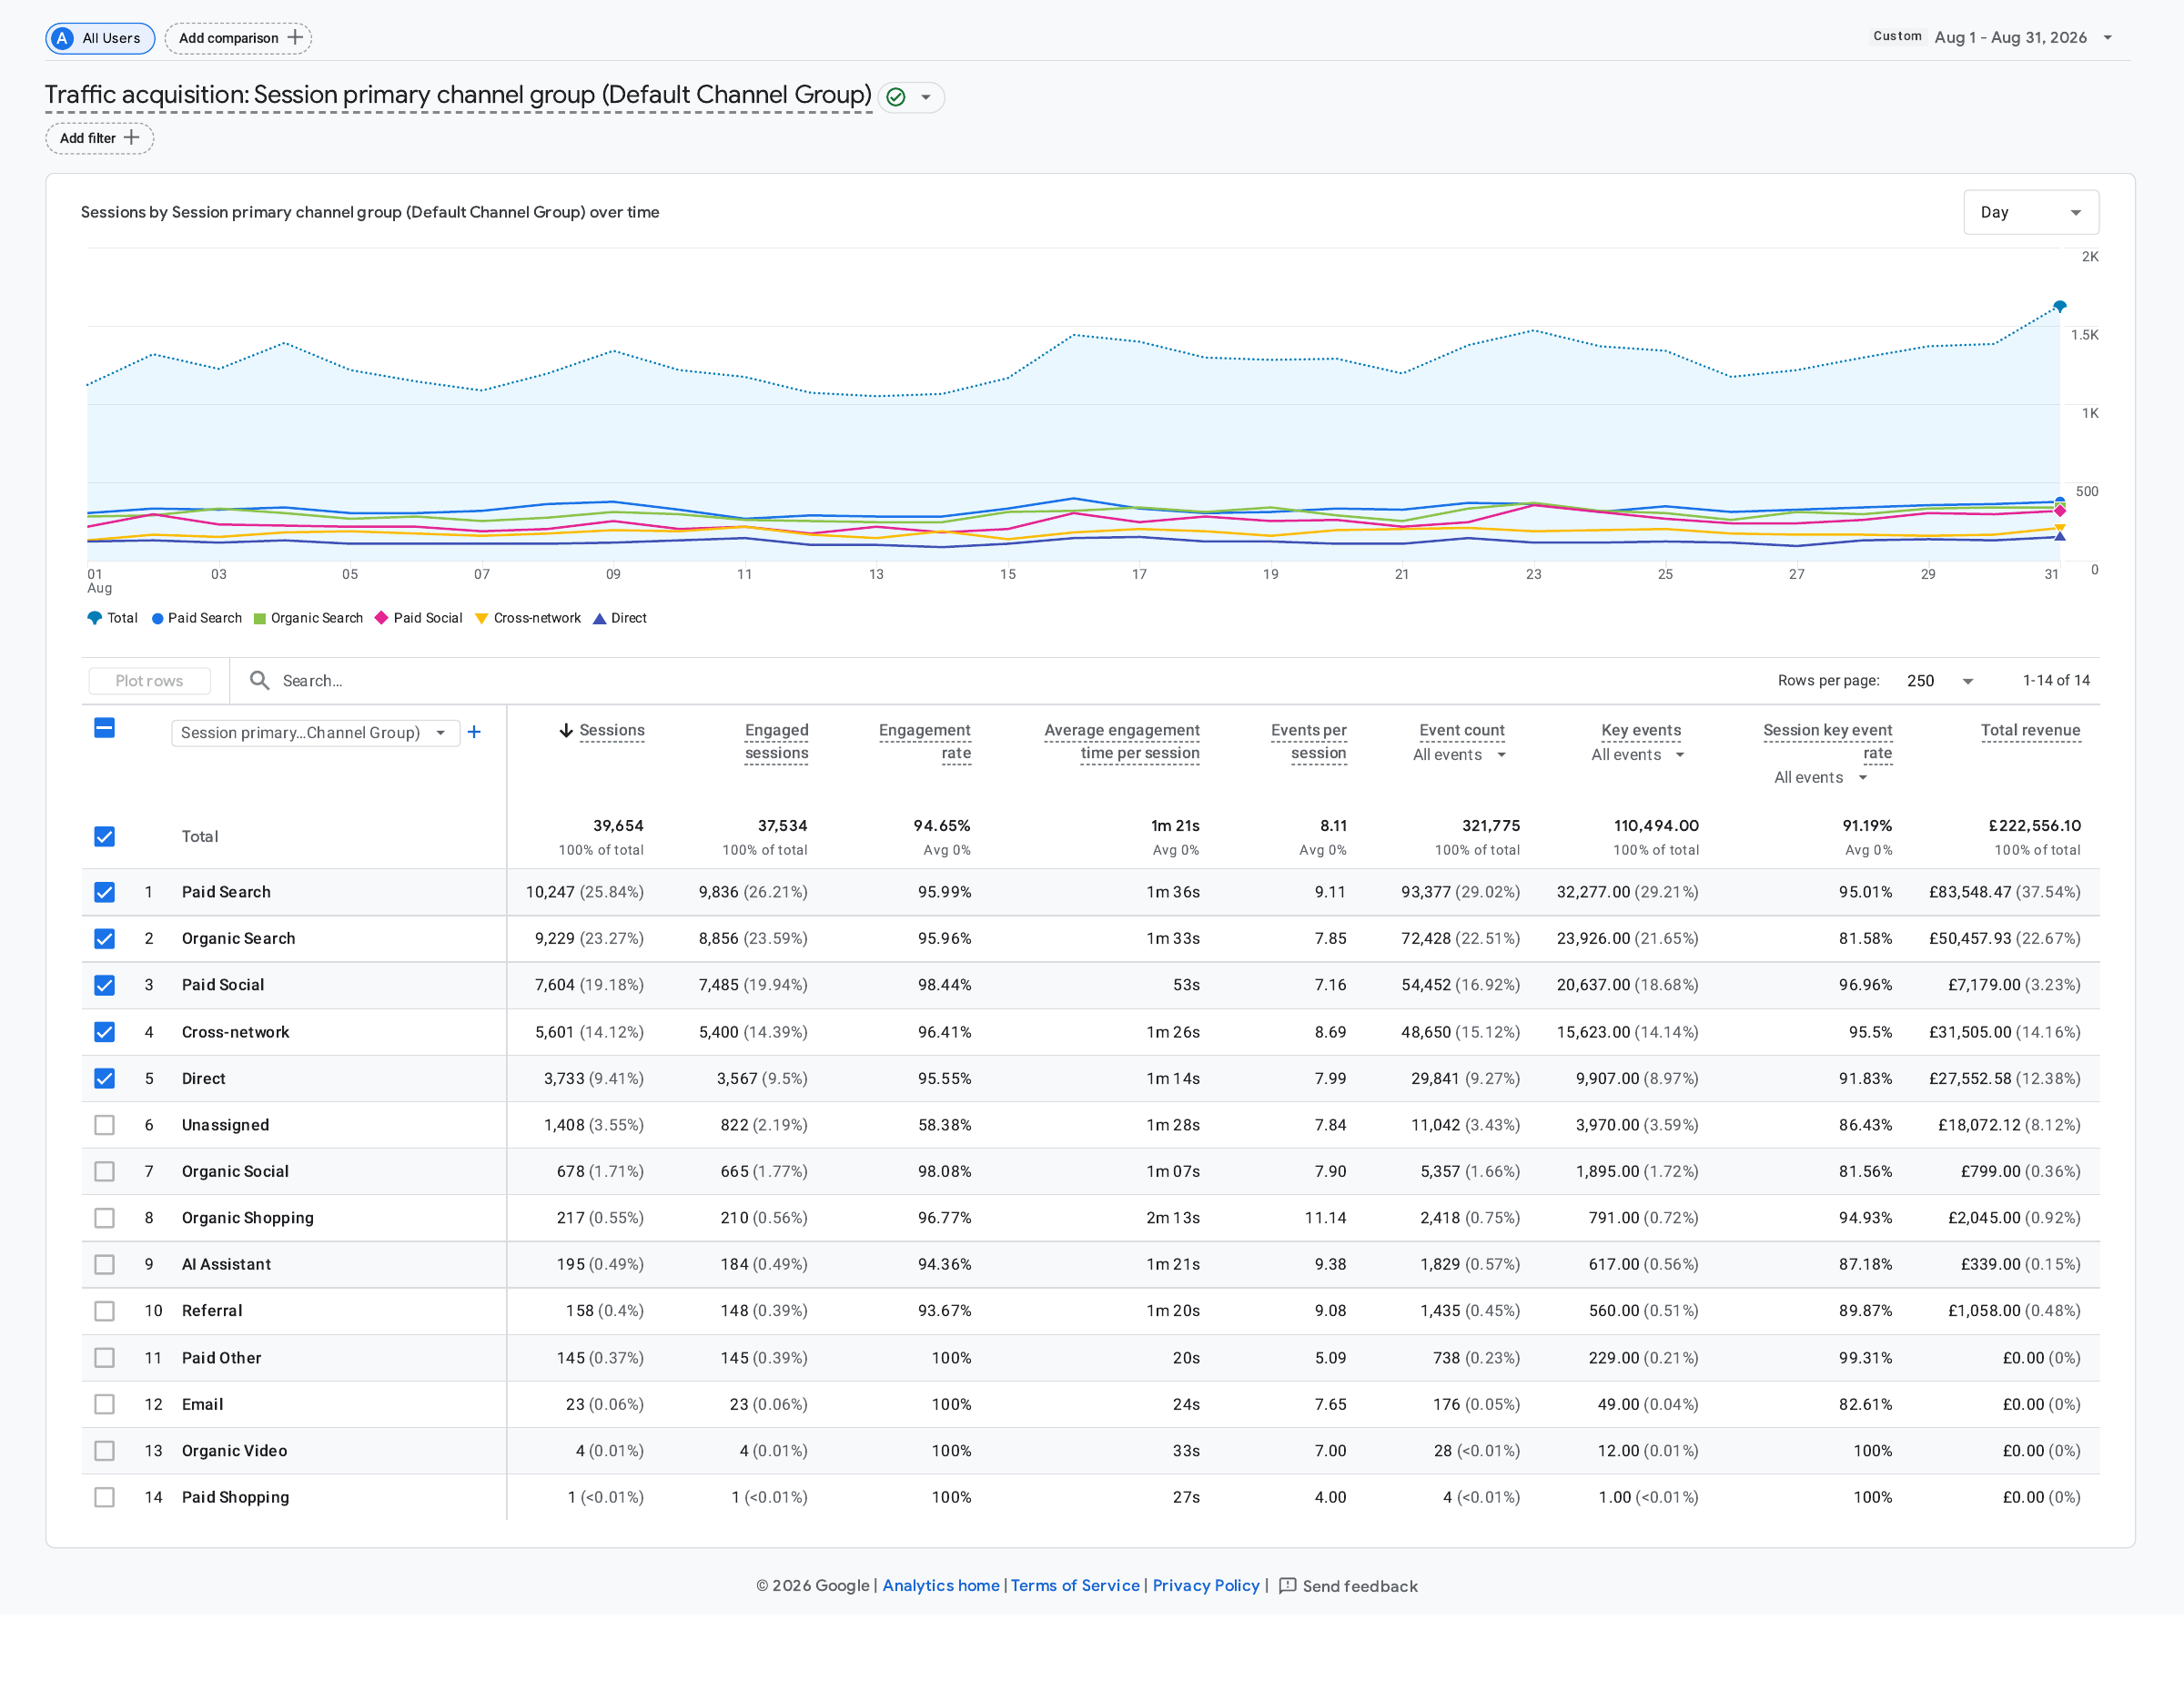
August 2026
1–31 Aug 2026. Table page from the supplied two-page export. Organic Search: 9,229 sessions and £50,457.93 revenue.
Open source image ↗
September 2026
1–30 Sep 2026. Organic Search: 7,977 sessions and £64,718.05 revenue. Event count uses All events, not purchase only.
Open source image ↗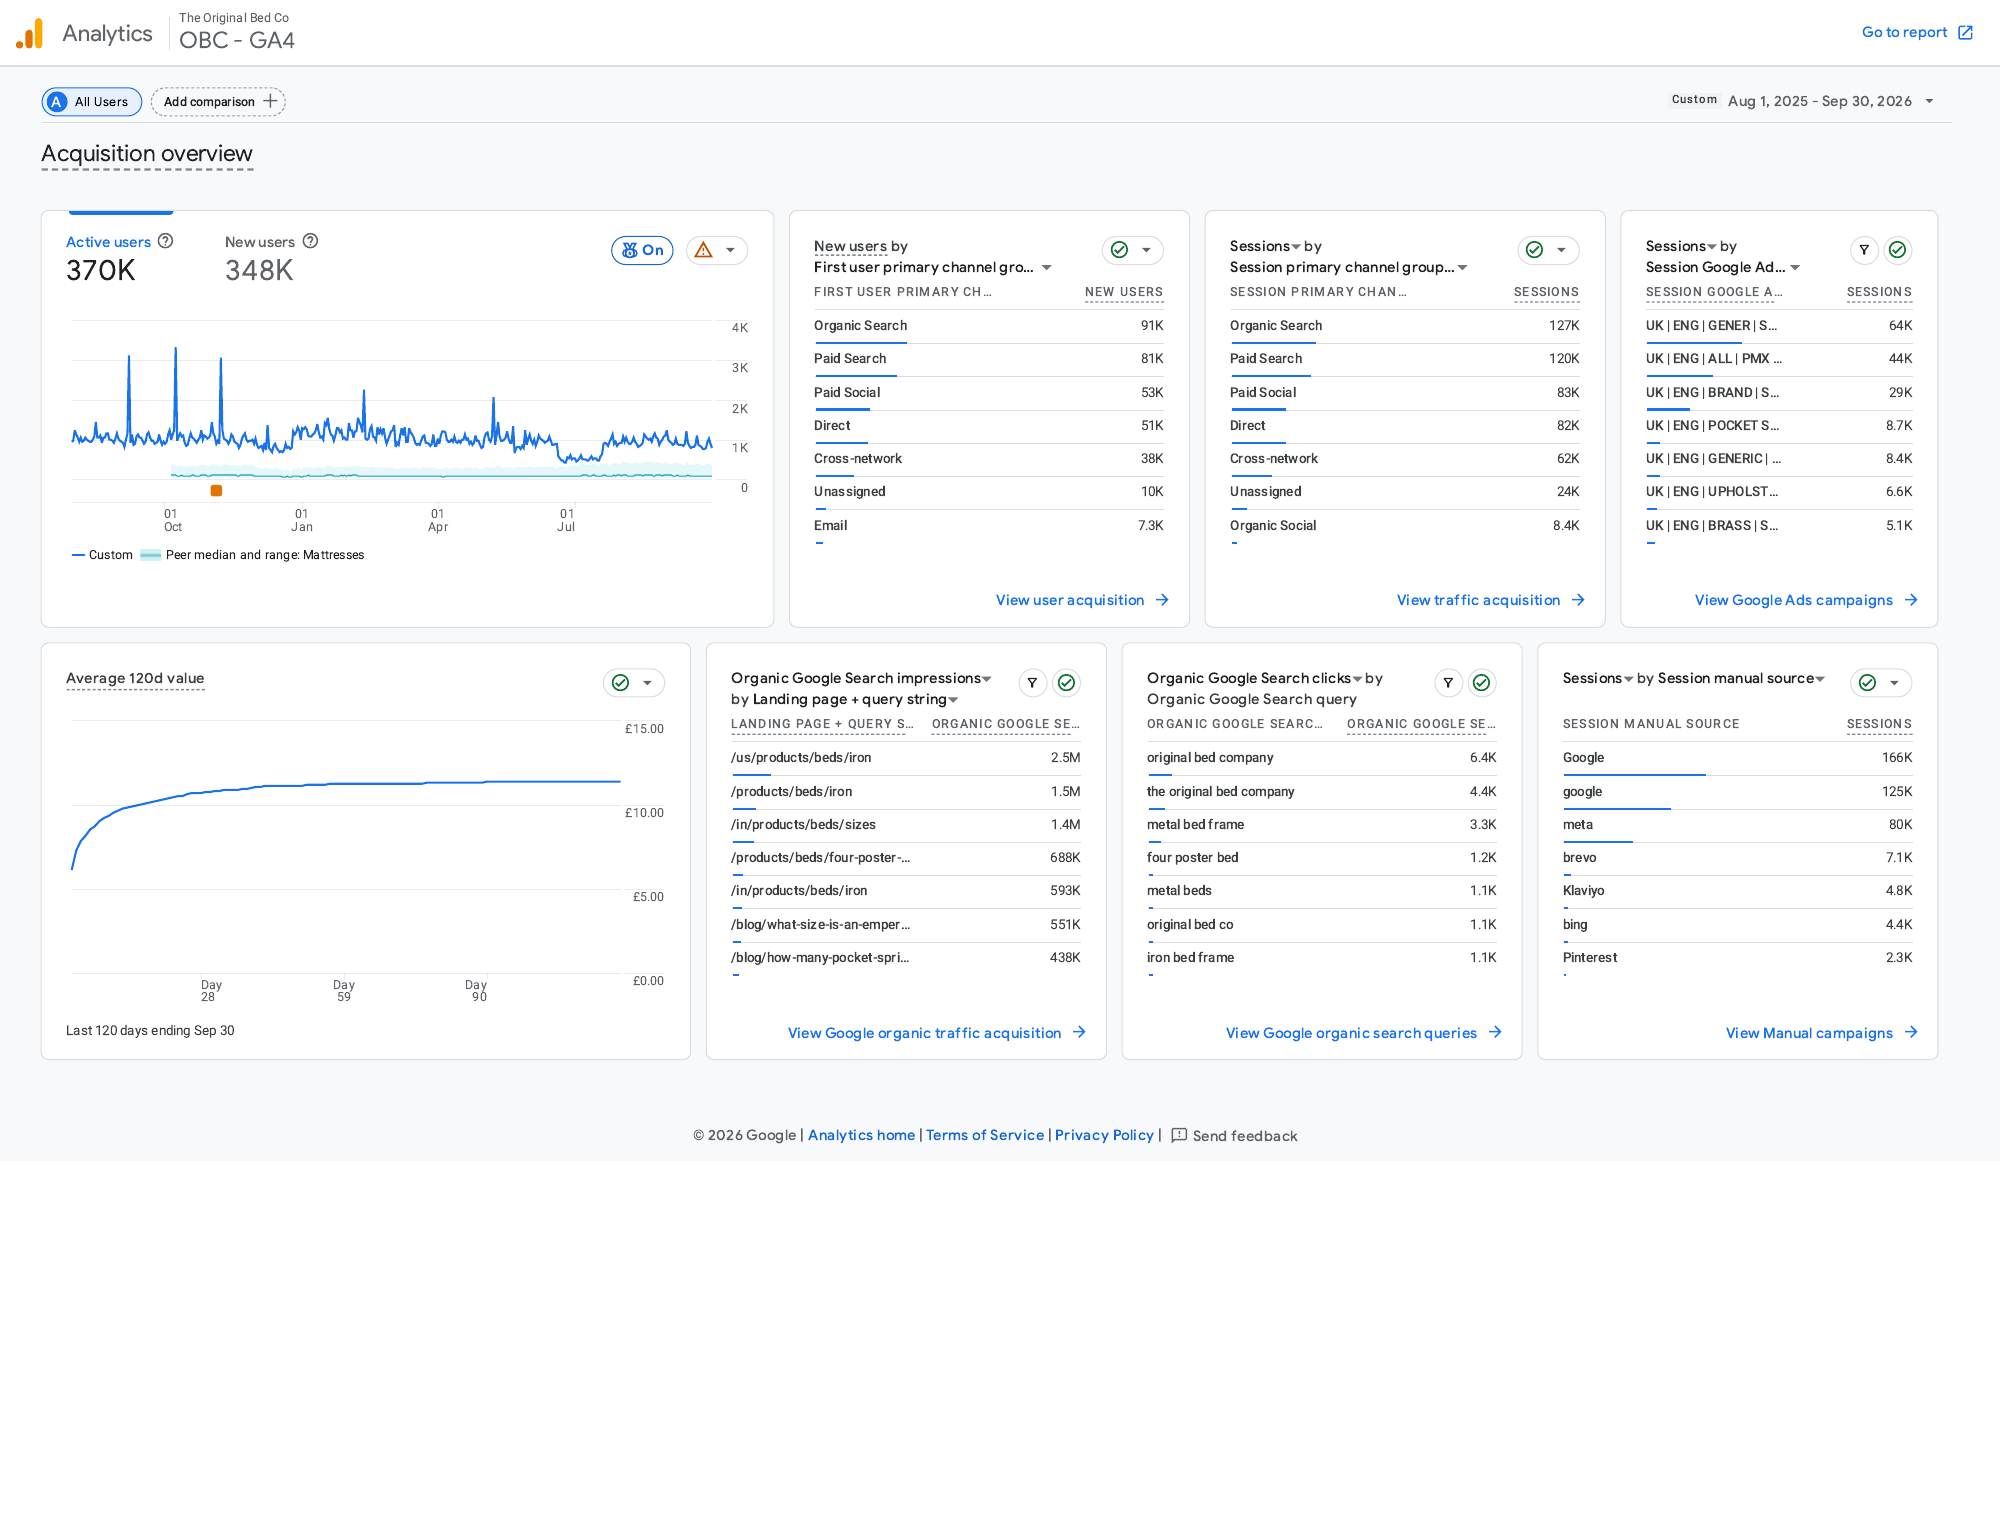
Acquisition overview
1 Aug 2025–30 Sep 2026. Supplied Acquisition_overview.pdf, rendered in full. The Google query-click and page-impression previews are shown with rounded values.
Open source image ↗Scope and next steps
Read the figures in context
Channel scope
Organic Search uses GA4’s session acquisition channel group. It can include multiple search engines. The query and impression previews are specifically Google organic search.
Measurement scope
761 is a recorded purchase-event count, not an independently verified unique-order total. Revenue follows GA4 reporting and attribution. All-event key-event counts and rates are not treated as purchase conversions.
Next priority
Review organic sessions and revenue by market and landing page, verify ecommerce measurement consistency, then use a detailed Search Console export to assess query and page trends.
Source files and calculation notes
14-month channel source: Traffic_acquisition_Session_primary_channel_group_(Default_Channel_Group) (3).pdf, All Users, with Event count set to purchase. Organic Search also records 69,080 engaged sessions and a 54.27% session engagement rate. It accounts for 16.89% of reported revenue and 15.76% of recorded purchase events.
Comparison sources: the same report name with suffix (4) for September 2025, (2) for August 2026 and (1) for September 2026. Percentage change = (new value ÷ comparison value − 1) × 100, rounded to two decimal places.
Google previews: Acquisition_overview.pdf. Displayed K/M values retain the source rounding. No full Google Search Console query export, CTR, average position or ranking-change data is supplied for this page.
The reporting periods overlap the 14-month aggregate; their revenues are not added to it. Changes in engagement and all-event key-event rates do not establish an engagement-growth claim or a tracking fault. Consistent definitions and verified store orders would be needed for stronger conversion conclusions.