

The Original Bed Co · Property-wide reporting
From visits to purchases
A website-performance view for 1 August 2025–30 September 2026: 528,798 sessions, 4,829 recorded purchase events and £3,702,841.14 in GA4-reported revenue.
14 calendar months · 426 days · All Users in OBC – GA4. Exact revenue: £3,702,841.14. This property-wide scope includes international page paths; the separate Meta reports identify a UK ad account.
Case study · Website performance analysis
What the data tells us
Understanding where The Original Bed Co’s traffic, recorded purchases and revenue come from, and how September’s performance changes when viewed against the previous month and the previous year.
The question
Which channels contribute to recorded purchases and revenue? The analysis connects acquisition, entry pages and ecommerce activity across the supplied 14-month period.
The approach
Reconcile the purchase totals, compare full reporting periods and inspect the channel mix. Monthly and year-over-year views sit alongside the original GA4 evidence, with each metric’s scope made clear.
The outcome
September revenue rose 19.53% from August 2026, while remaining 12.99% below September 2025. Search channels contributed to the monthly increase; the year-over-year view reveals a substantial change in Direct revenue.
This case study presents performance analysis and reported outcomes. The exports do not establish which individual actions caused the changes.
Audience and engagement
The scale of the visits
GA4 records 291,289 engaged sessions across the period. Organic Search is the largest session channel, while Direct has the highest reported channel revenue.
Total users comes from User acquisition. Landing page reports 369,677 active users; active users and total users are different metrics. These figures describe the full supplied period. The report includes an August–September 2026 comparison and a same-month comparison of September 2025 and September 2026.
Calendar-month comparison · August and September 2026
September, compared with August
September recorded £266,023.15 in GA4 revenue from 34,903 sessions. Revenue rose 19.53% while sessions fell 11.98%, increasing recorded revenue per session from £5.61 to £7.62.
| Metric | August 2026 | September 2026 | September change |
|---|---|---|---|
| Sessions | 39,654 | 34,903 | −11.98% |
| GA4-reported revenue | £222,556.10 | £266,023.15 | +19.53% |
| Revenue per session | £5.61 | £7.62 | +35.80% |
| Average engagement / session | 1m 21s | 1m 33s | +12 seconds |
Full calendar months: 1–31 August and 1–30 September 2026. On a daily basis, sessions fell 9.05% and revenue rose 23.52%. Both months are already included in the 14-month totals; their figures are not added to that aggregate again.
Where the revenue changed
| Session channel | August revenue | September revenue | Revenue change | Sessions change |
|---|---|---|---|---|
| Paid Search | £83,548.47 | £109,340.61 | +30.87% | −2.12% |
| Organic Search | £50,457.93 | £64,718.05 | +28.26% | −13.57% |
| Cross-network | £31,505.00 | £40,138.00 | +27.40% | −3.16% |
| Paid Social | £7,179.00 | £6,912.00 | −3.72% | −27.54% |
| Direct | £27,552.58 | £26,513.52 | −3.77% | −7.88% |
Search led the increase
Paid Search added £25,792.14 in reported revenue. Organic Search added £14,260.12 and Cross-network added £8,633.00. Each recorded more revenue despite fewer sessions.
Social traffic contracted
Paid Social sessions fell 27.54%, while GA4-attributed revenue fell 3.72%. Its September row accounts for 15.79% of sessions and 2.60% of revenue. Campaign profitability needs matching spend and purchase data.
Read the revenue result carefully
The monthly exports establish the revenue increase. Their all-event counts do not establish monthly purchase totals, so this view does not claim that purchase volumes or average order values increased.
Monthly comparison and measurement notes
Source: the supplied Traffic acquisition exports for August and September 2026, All Users in OBC – GA4. Values and percentage changes use the unrounded source totals.
Key events: the August and September session key-event rates are 91.19% and 91.73% with “All events” selected. They cover all marked key events and are not purchase-only conversion rates. The exports alone do not identify which events are marked or establish a tracking fault.
Interpretation: the comparison shows changes in GA4 reporting. It does not establish the cause, incremental impact, verified store order counts or advertising profit. The following section compares September 2026 with September 2025 separately.
Same-month comparison · September 2025 and September 2026
September, year over year
September 2026 recorded £266,023.15 in GA4 revenue, compared with £305,721.44 in September 2025. Reported revenue fell 12.99% and sessions fell 9.36% across the two 30-day periods.
| Metric | September 2025 | September 2026 | Year-over-year change |
|---|---|---|---|
| Sessions | 38,507 | 34,903 | −9.36% |
| GA4-reported revenue | £305,721.44 | £266,023.15 | −12.99% |
| Revenue per session | £7.94 | £7.62 | −4.00% |
All Users in OBC – GA4; 1–30 September in each year. These are observations from the supplied exports. The September 2025 period is also inside the 14-month aggregate; this comparison does not add another revenue total.
How the channel mix changed
| Session channel | September 2025 revenue | September 2026 revenue | Revenue change | Sessions change |
|---|---|---|---|---|
| Direct | £171,006.02 | £26,513.52 | −84.50% | −47.45% |
| Paid Search | £31,162.19 | £109,340.61 | +250.88% | +17.72% |
| Organic Search | £40,875.65 | £64,718.05 | +58.33% | −23.72% |
| Cross-network | £19,667.00 | £40,138.00 | +104.09% | +36.42% |
| Paid Social | £3,733.00 | £6,912.00 | +85.16% | +31.69% |
Direct revenue fell
Direct fell from £171,006.02 to £26,513.52, a £144,492.50 reduction. The exports establish the reported change; they do not establish its cause.
Search increased
Paid Search revenue rose 250.88%, Organic Search 58.33% and Cross-network 104.09%. Those increases did not fully offset reductions elsewhere in the reported channel mix.
Two comparisons, two outcomes
September revenue rose 19.53% from August 2026 while remaining 12.99% below September 2025. Monthly recovery and year-over-year performance describe different comparisons.
Year-over-year scope and measurement notes
The September 2025 export records 419 purchase events. The supplied September 2026 export still uses All events for Event count, so a purchase-selected September 2026 export is needed before calculating year-over-year purchase growth.
The exports show engagement rates of 47.47% and 95.27%, and materially different all-event key-event rates. Consistent event and reporting definitions have not been verified; this section makes no engagement-growth or purchase-conversion claim. The session and revenue comparisons retain the source values.
Session acquisition
Where the visits came from
Organic Search records 127,282 sessions and £625,407.80 in GA4 revenue. Paid Search follows with 119,579 sessions and £782,568.35.
Direct records 81,922 sessions and £1,343,124.48 in revenue. Paid Social records 82,505 sessions and £57,378.00. These are GA4 session-channel results; the Meta case studies use Meta’s own reporting scope and attribution.
Common scale: 0–130,000 sessions. Channels are sorted by sessions in this chart.
| Session channel | Sessions | Recorded purchase events | GA4 revenue |
|---|---|---|---|
| Organic Search | 127,282 | 761 | £625,407.80 |
| Paid Search | 119,579 | 1,013 | £782,568.35 |
| Paid Social | 82,505 | 66 | £57,378.00 |
| Direct | 81,922 | 1,771 | £1,343,124.48 |
| Cross-network | 61,558 | 501 | £338,997.00 |
| Unassigned | 24,357 | 643 | £503,566.31 |
| AI Assistant | 739 | 4 | £1,616.00 |
The purchase-selected acquisition export records 1,771 events in Direct (36.67% of the total), 1,013 in Paid Search (20.98%) and 761 in Organic Search (15.76%). These are recorded purchase events attributed to session channels.
View all 16 session channels
| Session channel | Sessions | Recorded purchase events | GA4 revenue |
|---|---|---|---|
| Organic Search | 127,282 | 761 | £625,407.80 |
| Paid Search | 119,579 | 1,013 | £782,568.35 |
| Paid Social | 82,505 | 66 | £57,378.00 |
| Direct | 81,922 | 1,771 | £1,343,124.48 |
| Cross-network | 61,558 | 501 | £338,997.00 |
| Unassigned | 24,357 | 643 | £503,566.31 |
| Organic Social | 8,400 | 11 | £9,792.78 |
| 7,082 | 0 | £0.00 | |
| Organic Shopping | 3,650 | 37 | £22,865.00 |
| Paid Shopping | 3,629 | 2 | £1,777.00 |
| Referral | 2,914 | 18 | £13,000.44 |
| Display | 835 | 0 | £0.00 |
| Paid Other | 808 | 2 | £2,748.00 |
| AI Assistant | 739 | 4 | £1,616.00 |
| Organic Video | 49 | 0 | £0.00 |
| Paid Video | 26 | 0 | £0.00 |
The report total is retained as supplied: 528,798 sessions and £3,702,841.14 revenue. Its channel rows sum to 525,335 sessions and £3,702,841.16; the source does not establish the reason for these differences. Headline totals are not rebuilt by adding rows.
Ecommerce measurement
The recorded purchases
The Events report records 4,829 purchase events across 4,755 users, alongside £3,702,841.14 in revenue. The report places all its revenue on the purchase event.
| Event | Event count | Users triggering event |
|---|---|---|
| add_to_cart | 10,298 | 6,325 |
| begin_checkout | 11,345 | 7,398 |
| purchase | 4,829 | 4,755 |
Counts are event totals, and users can trigger an event more than once. These rows are not a sequential conversion funnel or independently verified unique store orders. The purchase-selected acquisition report now provides the channel breakdown above. All 16 purchase rows sum exactly to 4,829, matching the Events report total. Purchase event counts divided by sessions are not presented as purchase conversion rates.
Session entry pages
The pages people arrived on
The homepage leads with 104,486 sessions, followed by the iron-bed collection with 75,836. Hamilton low footend records £100,107.75 in GA4 revenue associated with sessions starting on that page.
| Landing page | Sessions | Avg engagement / session | GA4 revenue |
|---|---|---|---|
| Homepage · / | 104,486 | 1m 12s | £696,156.37 |
| Iron beds · /products/beds/iron | 75,836 | 1m 15s | £366,675.98 |
| Upholstered beds · /products/beds/upholstered | 13,400 | 49s | £25,447.00 |
| Hamilton low footend · /products/beds/iron/hamilton-low-footend | 12,908 | 1m 20s | £100,107.75 |
| Mattresses · /products/mattresses | 12,030 | 1m 05s | £88,161.00 |
These selected rows come from the leading 250 of 2,460 landing pages in the PDF. Revenue is reported against the landing-page dimension; it is not evidence that a page caused those sales.
Landing-page measurement points
(not set): 19,728 sessions have no named landing page in this report.
Checkout and receipt: /checkout appears with 3,863 sessions and £1,294,027.20 revenue, representing 34.95% of the reported revenue total. /receipt also appears as a landing page, with 2,906 sessions and £85,827.95 revenue.
These observations warrant a session and checkout tracking review before using the figures to make page-efficiency claims. Their cause is not established by the PDF.
AI Assistant channel
AI referrals in the mix
The Traffic acquisition report includes an AI Assistant row with 643 engaged sessions, an 87.01% engagement rate and 1m 08s average engagement per session. User acquisition separately records 511 users whose first-user channel is AI Assistant.
A measured contribution
The purchase-selected report records four purchase events in the AI Assistant session channel, representing 0.08% of the 4,829-event total, alongside £1,616.00 in reported revenue. These are event counts rather than independently verified unique store orders. Individual assistant source/medium detail and matched-period AI growth remain unavailable.
First-user channel and session channel describe different scopes; their user and session counts are not added together. The AI Assistant row’s 1,641 key events and 70.37% session key event rate use “All events” and are not purchase-specific figures.
Evidence-led priorities
Where the evidence points next
Review search performance
Paid Search and Organic Search recorded more revenue in September despite fewer sessions than August. Review the contributing campaigns and entry pages, alongside matching costs and purchase data, before drawing conclusions about efficiency.
Investigate the Direct shift
September’s year-over-year Direct revenue reduction is a major change to explain. Check channel attribution, session continuity and checkout reporting against the store’s orders. The supplied exports show the change but do not establish its cause.
Track AI referrals over time
The AI Assistant channel has four recorded purchase events in the aggregate period. Treat this as a measured starting point: inspect source/medium detail and consistent monthly periods before making an AI-growth claim.
These are proposed next steps from the analysis, rather than completed changes to OBC’s website or analytics setup.
Supplied GA4 reporting
Evidence behind the numbers
Open a report image to inspect its dates, scope and figures at full size. The 14-month view and monthly comparison each retain their own source period.

14-month traffic acquisition
Sessions, engagement, channel revenue and the AI Assistant row. Rendered from page 1 of the supplied Traffic acquisition PDF.
View full-size evidence ↗
Recorded purchase events
The Events report records 4,829 purchase events, 4,755 users triggering purchase and £3,702,841.14 in revenue. Rendered from page 1.
View full-size evidence ↗
Audience and first-user channels
The User acquisition report shows total users, new users and first-user channels, including AI Assistant. Rendered from page 1 of the supplied 200228 PDF.
View full-size evidence ↗
Leading landing pages
The date range, total figures and leading entry-page rows. Rendered from page 1 of the supplied Landing page PDF; the full export covers 250 of 2,460 rows.
View full-size evidence ↗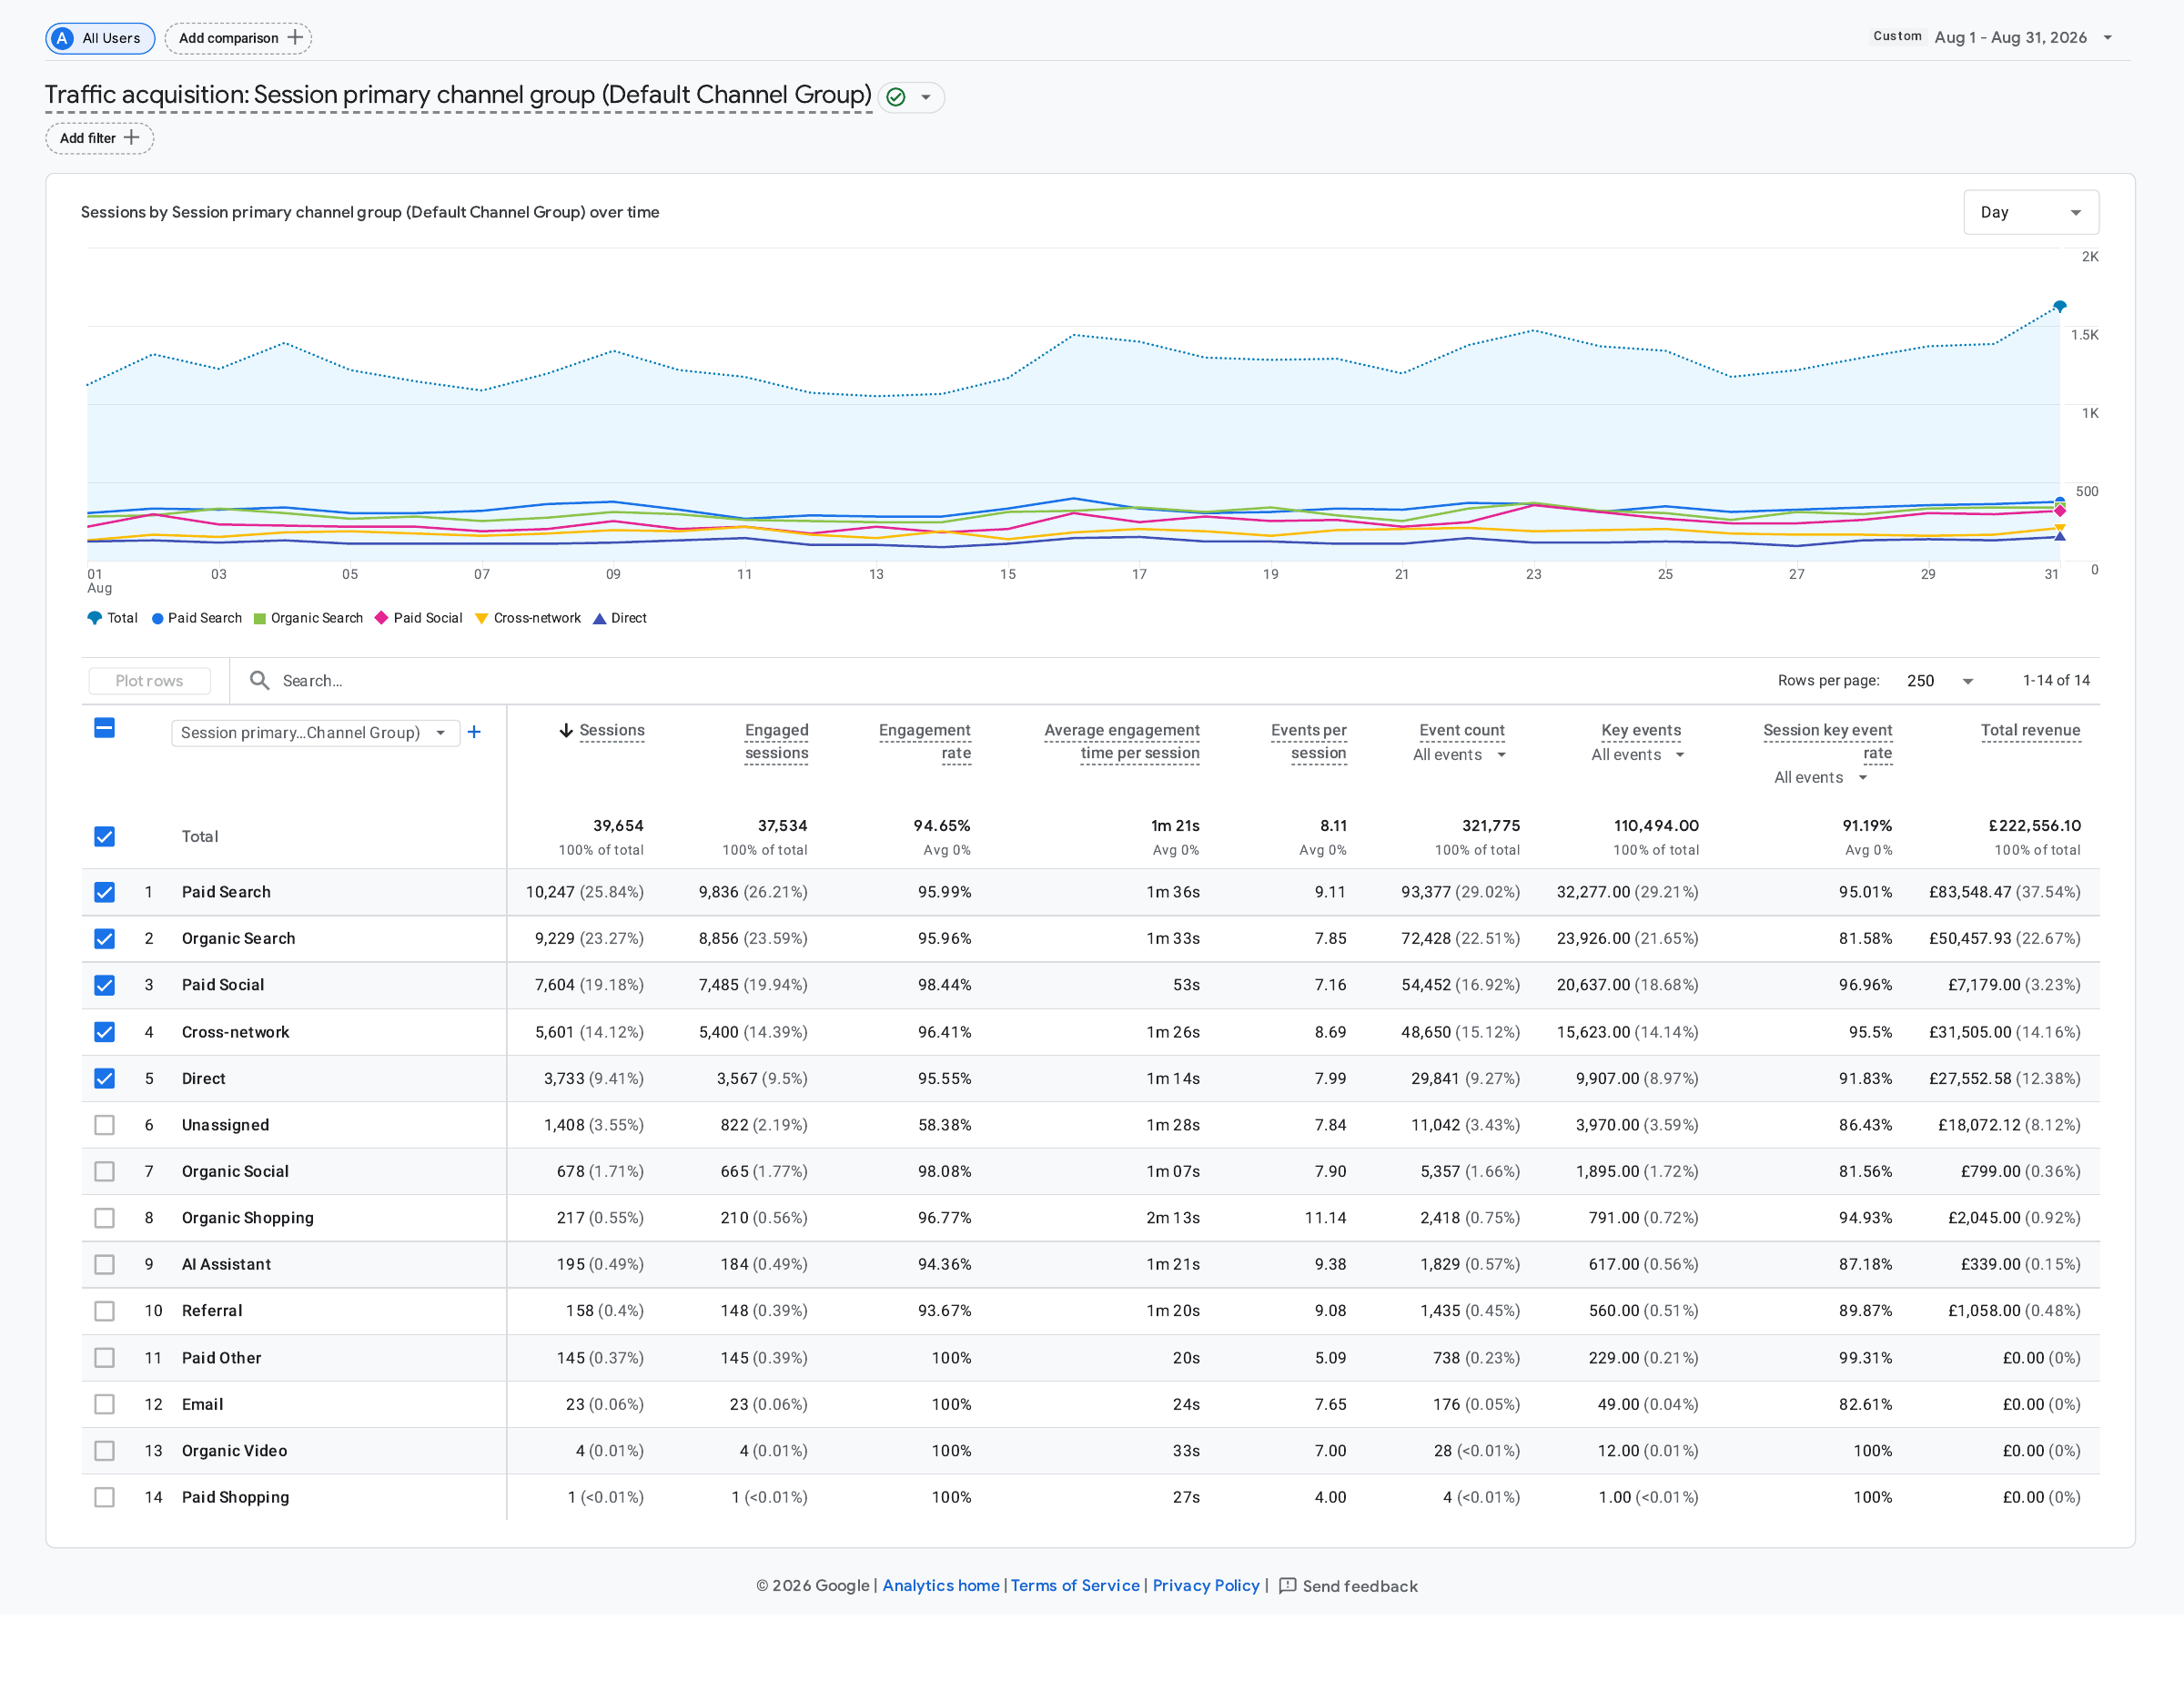
August 2026 acquisition
Full-month traffic acquisition for 1–31 August 2026, with all displayed channel rows and the £222,556.10 revenue total. Rendered from page 2 of the supplied PDF.
View full-size evidence ↗
September 2026 acquisition
Full-month traffic acquisition for 1–30 September 2026, with all displayed channel rows and the £266,023.15 revenue total. Rendered from the supplied PDF.
View full-size evidence ↗
Purchase events by session channel
The purchase-selected acquisition export for 1 August 2025–30 September 2026. The image shows page 1; the complete two-page PDF includes all 16 channel rows.
View full-size evidence ↗Read complete 2-page PDF ↗
September 2025 acquisition
The 1–30 September 2025 baseline: 38,507 sessions, 419 purchase events and £305,721.44 reported revenue. Rendered from page 2; the complete PDF retains the property header.
View full-size evidence ↗Read complete 2-page PDF ↗Source and scope
The evidence behind the view
The aggregate view uses the supplied OBC – GA4 exports for 1 August 2025–30 September 2026 and All Users. The monthly comparison uses separate acquisition exports for August and September 2026; the year-over-year view adds September 2025. A purchase-selected acquisition export supplies all 16 channel purchase counts. The case study reports the observed outcomes; the exports do not establish individual responsibilities, which creative changes caused them, or incremental impact.
| Report | Evidence used |
|---|---|
| User acquisition · First user channel | Total users, new users and first-user AI channel |
| Traffic acquisition · Session channel | Sessions, engagement, channel purchase events, channel revenue and AI Assistant |
| Events · Event name | Purchase event count, users and revenue |
| Landing page | Leading entry pages, engagement and revenue |
Reporting definitions and pending additions
Attribution: GA4 session-channel revenue and Meta-attributed purchase value are separate reporting views. They are not combined to claim an overall advertising return.
Key events: the supplied acquisition and landing-page reports use “All events”. Their key-event counts and rates are not purchase-only conversions.
Period: 1 August 2025–30 September 2026 is a 14-month period. The same-month comparison now reports September 2026 versus September 2025 sessions and revenue.
Pending: purchase-selected monthly exports for August and September 2026, purchase-specific session rates and individual assistant source/medium detail.
The Acquisition overview and manual-campaign report are supporting views. Campaign names alone are not used to identify an assistant referral source, and campaign revenue is not added again to channel totals.